19. Sept. 2649 min read
Published by Vaapad Capital
Published: 19. Sept. 26. Author, if named: in the article. Research does not establish contemporaneous trade rationale.
Published by Vaapad Capital
Published: 19. Sept. 26. Author, if named: in the article. Research does not establish contemporaneous trade rationale.
Two silver stories, one price deck. Both projects are set on the latest business date, 18 September 2026: silver $66.13/oz, gold $4,377/oz, lead $1,868/t or $0.84731/lb and zinc $4,010/t or $1.81891/lb. Gold and silver are Kitco spot bids, lead and zinc are LME cash references, same business date, different fixing times. Rounded market capitalisations are approximately $1.1bn and $2.0bn; cash balances are from 30 June. The simplified EV deducts that cash; leases, other obligations and subsequent uses of funds are not individually reconciled in it.
| Highlander Silver (HSLV) | Hycroft Mining (HYMC) | |
|---|---|---|
| Market capitalisation, rounded September snapshot | ~$1.1bn | ~$2.0bn |
| Closing price, 18 September 2026 | C$7.67 (TSX) | US$21.40 (NASDAQ) |
| 52-week high, respective trading currency | C$10.50 | US$58.73 |
| Decline from the 52-week high to the reference date | −27.0% | −63.6% |
| Simplified EV after reported cash | ~$1.00bn | ~$1.779bn |
| Cash / loan debt, 30 June 2026 | ~$99.3M / none | ~$221M / none |
| Project financing | Mandate for a $330M senior secured, 7-year, fully underwritten facility (Natixis CIB, 23 Sept. 2026); closing expected Q1 2027 | none |
| Core project | Corani, Peru | Hycroft, Nevada |
| Study stage / next catalyst | Feasibility 2019; updated feasibility announced for Q4 2026 | Initial Assessment, June 2026; not yet feasibility |
| Path to new production, my assessment | Corani likely earlier: feasibility/permitting foundation, ongoing site works, financing mandated | Further studies, permits and funding for the new sulphide operation |
| Geological discovery stage | Feeder/porphyry targets still await new discovery evidence | Vortex/Brimstone high-grade zones drilled; feeder structures interpreted |
| Permits | Existing Corani development plan permitted; conditions and plan changes remain relevant | Additional permits required for the new processing plan |
| Initial capex | $579M (2019); my current assumption $900M | $2,434M (2026 study) |
| Sustaining capex over study mine life | $22.5M over 15 years (2019 study) | $3,107M over 51 years (2026 study) |
| Initial capex ÷ market capitalisation | ~0.5x historical; ~0.8x at $900M | ~1.2x |
| Processing | Flotation → lead and zinc concentrates containing silver | Flotation → autoclave (pressure oxidation/POX) → leaching |
| Silver grade, different reference bases | 42.1 g/t M&I; 51.3 g/t reserve | ~15 g/t planned mill feed |
| Published AISC, different denominators | $4.55/oz silver net of Pb/Zn credits (2019) | $2,147/oz AuEq at GSR 75; arithmetic equivalent $28.63/oz AgEq |
| Author annual model, NPV₅ after modelled taxes | 2.57 bn USD | 7.34 bn USD |
| Annual silver production, study average | 9.6 Moz payable | ~6.8 Moz, plus ~204 koz gold |
| Silver share of all payable metal revenue, reference prices | 75.2 % | 33.5 % |
| Published after-tax IRR, different price cases | 22.9% at $18 Ag, 2019 study | 16.9% at $48 Ag / $3,600 Au |
| Published payback, different price cases | 2.4 operating years at $18 Ag | 4.7 years in the base case |
| Producing portfolio operation | Mercedes: 8,147 oz Au + 34,583 oz Ag (Q2 2026) | Active mining ended in November 2021; residual processing through December 2022 |
| Second project / exploration | San Luis: 24.4 g/t Au, 579 g/t Ag, Indicated | Brimstone and Vortex: confirmed high-grade drill intervals |
| Drilling history | ~180 m average hole length (562 holes through 2019); 2026 company information to the author: planned average 300 m, some holes >600 m | Published Vortex intervals extend beyond 500 m downhole; not a comparison of maximum vertical depths |
| GDXJ / SIL, 17 September 2026 | 0.06% / 0.43% | 0.33% / 0.56% |
| Insiders, dated disclosures | Warke: 23.2% beneficial ownership, partly diluted, 10 March 2026 | Thomas: sold 25,000 shares, 16 June; retained a holding |
| Model IRR / payback from operating start | 42.0 % / 1.47 years | 23.7 % / 3.68 years |
Read the table as two different answers to the same question: how much does it cost, and how long does it take, to turn an ounce in the ground into a dollar in the bank. Hycroft has more metal and the higher absolute project NPV. Corani requires less initial capital, recovers it faster in the model and gives the investor more of what a silver investor actually wants, which is silver. The asymmetry sits in one line: Corani is more advanced in feasibility, permitting and now financing, while its possible high-grade feeder and porphyry story still awaits discovery evidence. Hycroft already has drilled high-grade zones the market knows about; I consider that part of its discovery story more fully priced. Highlander still has the new study, potential resource growth and deep drilling ahead of it as revaluation steps. The "mine" in the title means the Corani development project. Production still has to be established, and this text is about why I expect it to be.
Every screen that ranks silver developers starts with the same shortcut: enterprise value divided by contained ounces. On that shortcut Hycroft wins, and it is the only line in the table where it does. An ounce in the ground is not cash flow. It is a claim on a future ounce, and the value of that claim depends on what it costs to extract, whether someone has permitted it, how long capital sits at risk, and whether the company can pay for the start. The decisive question is never how many ounces, but how much capital and time it takes to turn them into money.
First, the shortcut itself, done properly. Hycroft's M&I base contains 16.414 Moz gold and 562.575 Moz silver. Highlander has 322.7 Moz silver at Corani, 8.4 Moz silver and 356 koz gold at San Luis, plus Corani's lead and zinc. The following gross calculation prices that contained metal on the same reference deck. It describes the metal mix; the cash-flow model later uses payable production only.
The reference gold-silver ratio is 66.19. In the bull cases, gold remains at $4,377 and lead and zinc stay unchanged: GSR 30 means $145.90 silver; GSR 15 means $291.80. This specifically tests a silver bull market. A ratio falling because gold declines would have a different economic effect.
| Gross M&I metal value expressed in silver | Highlander | Hycroft |
|---|---|---|
| Reference · 66.13 $ Ag | 462.69 Moz | 1,648.98 Moz |
| EV / gross AgEq | 2.16 $ | 1.08 $ |
| Silver share | 71.6 % | 34.1 % |
| GSR 30 · 145.90 $ Ag | 390.74 Moz | 1,055.00 Moz |
| EV / gross AgEq | 2.56 $ | 1.69 $ |
| Silver share | 84.7 % | 53.3 % |
| GSR 15 · 291.80 $ Ag | 360.92 Moz | 808.79 Moz |
| EV / gross AgEq | 2.77 $ | 2.20 $ |
| Silver share | 91.7 % | 69.6 % |
Hycroft's gold is fully included, and that is exactly what makes the difference visible. Two thirds of Hycroft's equivalent ounces are gold wearing a silver costume. When silver rises faster than gold, Highlander's metal mix barely changes and its greater silver exposure does the work. In the annual model, Corani's NPV₅ reaches 2.64 times its reference value at GSR 30, versus 1.89 times for Hycroft; at GSR 15, 5.62 versus 3.51 times. Those figures compare project values with production plans held constant, rather than merely shrinking an equivalent-ounce denominator.
The thesis is built from connecting three things: metal mix determines price exposure, processing determines costs and capital, and project stage determines the path to financing. Today's resource statement is a starting base, not a ceiling. A higher price deck may enlarge that base, and a feeder or porphyry discovery could add a geological dimension that no resource statement yet contains. I am buying development progress and the still-open discovery stage together. The updated Corani study is the next point at which the market can reassess parts of that combination.
The silver market is expected to record its sixth consecutive deficit year. Previous shortfalls had to be met from above-ground stocks. Those buffers have shrunk, though not to zero, and the continued pressure on available inventory is the floor under every valuation in this text.
| Silver market (Silver Institute, World Silver Survey 2026) | 2025 | 2026 forecast |
|---|---|---|
| Market deficit | 40.3 Moz; fifth consecutive year | 46.3 Moz; sixth year |
| Cumulative deficit from 2021 | ~716 Moz realised through 2025 | ~762 Moz including the forecast |
| Mine production | 846.6 Moz; +3% | 844.1 Moz |
| Industrial demand | 657.4 Moz | 639.6 Moz |
| Photovoltaic demand | 186.6 Moz | 151.0 Moz |
| Coins and net bars | 217.7 Moz; +14% | 257.6 Moz; ~+18% |
| Average silver price | $40.03; +42% | No annual average assumed here |
Three lines in this table carry the thesis.
Supply responds slowly. In 2025, mine production rose by approximately 3 percent while the average silver price rose by 42. Around 70 percent of mined silver is a by-product of lead, zinc, copper and gold. Those mines produce silver when the main metal justifies it, not when silver is expensive. The price can double without a single by-product mine changing its plan. New primary silver mines are the only elastic part of supply, and that is Corani's strategic value: a large primary silver deposit that is already well advanced in development.
The deficit persists despite savings. In 2025, photovoltaic silver demand fell by roughly 6 percent despite rising solar installations. Manufacturers reduced silver loadings and partly substituted other materials, and the World Silver Survey forecasts a further decline for 2026. That is the bears' best argument, and it is already inside the demand figures. The market stayed in deficit anyway. Investment demand moved the other way: coins and bars up 14 percent, with a further 18 percent expected in 2026. Solid-state batteries could add another demand line over the longer term; Samsung SDI targets mass production in the second half of 2027. That does not yet establish a reliable quantity of silver per vehicle or assured market demand. I treat it as a possibility; neither its scale nor its timing enters the model.
Silver exposure changes the investment. At reference prices, silver accounts for 75.2 percent of payable metal revenue in Corani's plan and 33.5 percent at Hycroft. At GSR 30, that rises to approximately 87.0 versus 52.6 percent; at GSR 15, 93.0 versus 69.0 percent. When silver runs, capital looks for silver exposure, not for gold with a silver garnish. Highlander is the more direct instrument for my silver thesis. Hycroft's gold is valuable and fully included in the model, but it dilutes the effect of a silver-only rally on the whole project.
A useful cost comparison starts before by-product credits, with the actual annual mining, processing, transport and smelter costs, and then sets all metal revenues against them. Done that way, both the cost of the plant and the contribution of gold, lead and zinc become visible, and neither company gets to hide behind a favourable denominator.
Hycroft's study reports $2,147 AISC per gold-equivalent ounce at $3,600 gold and $48 silver. That gives a ratio of 75:1 and the conversion 2,147 ÷ 75 = $28.63/oz AgEq. It still describes combined gold and silver production, not net silver costs after a gold credit. Corani's historical $4.55/oz silver already deducts lead and zinc credits. Both are shortcuts, and they do not match. The model below replaces them with the complete cost and revenue calculation. Averages cover the respective 15 and 51 operating years; the DCF calculates each year separately.
| Annual average, reference prices | Corani | Hycroft |
|---|---|---|
| Mining | 51.5 M USD | 170.2 M USD |
| Processing | 120.6 M USD | 357.7 M USD |
| Site administration | 22.6 M USD | 13.0 M USD |
| Concentrate freight | 29.8 M USD | 0.0 M USD |
| Treatment/refining | 57.9 M USD | 4.4 M USD |
| Private NSR royalties | 24.6 M USD | 28.7 M USD |
| Total cash costs | 307.0 M USD | 574.0 M USD |
| All-metal revenue | 844.9 M USD | 1,345.3 M USD |
| Of which silver / gold / lead / zinc | 635.4 / 0.0 / 83.4 / 126.1 M USD | 450.5 / 894.7 / 0.0 / 0.0 M USD |
| Operating cash before tax/capex | 537.9 M USD | 771.2 M USD |
| Operating margin on all-metal revenue | 63.7 % | 57.3 % |
| Model cost per AgEq including sustaining/closure | 24.50 $ | 31.45 $ |
Net silver costs can now be calculated consistently: including sustaining and closure, $10.78/oz at Corani and −$37.43/oz at Hycroft, both before government taxes. Hycroft's negative number results from lifetime-average gold revenue exceeding the full modelled cost base. It is neither a calculation error nor proof of free silver; it is what happens when a gold mine reports silver costs. The comparison therefore focuses on all-metal margins, cash-flow timing and returns on invested capital. Corani achieves a 63.7 percent operating margin versus 57.3; each project's other metals are counted exactly once.
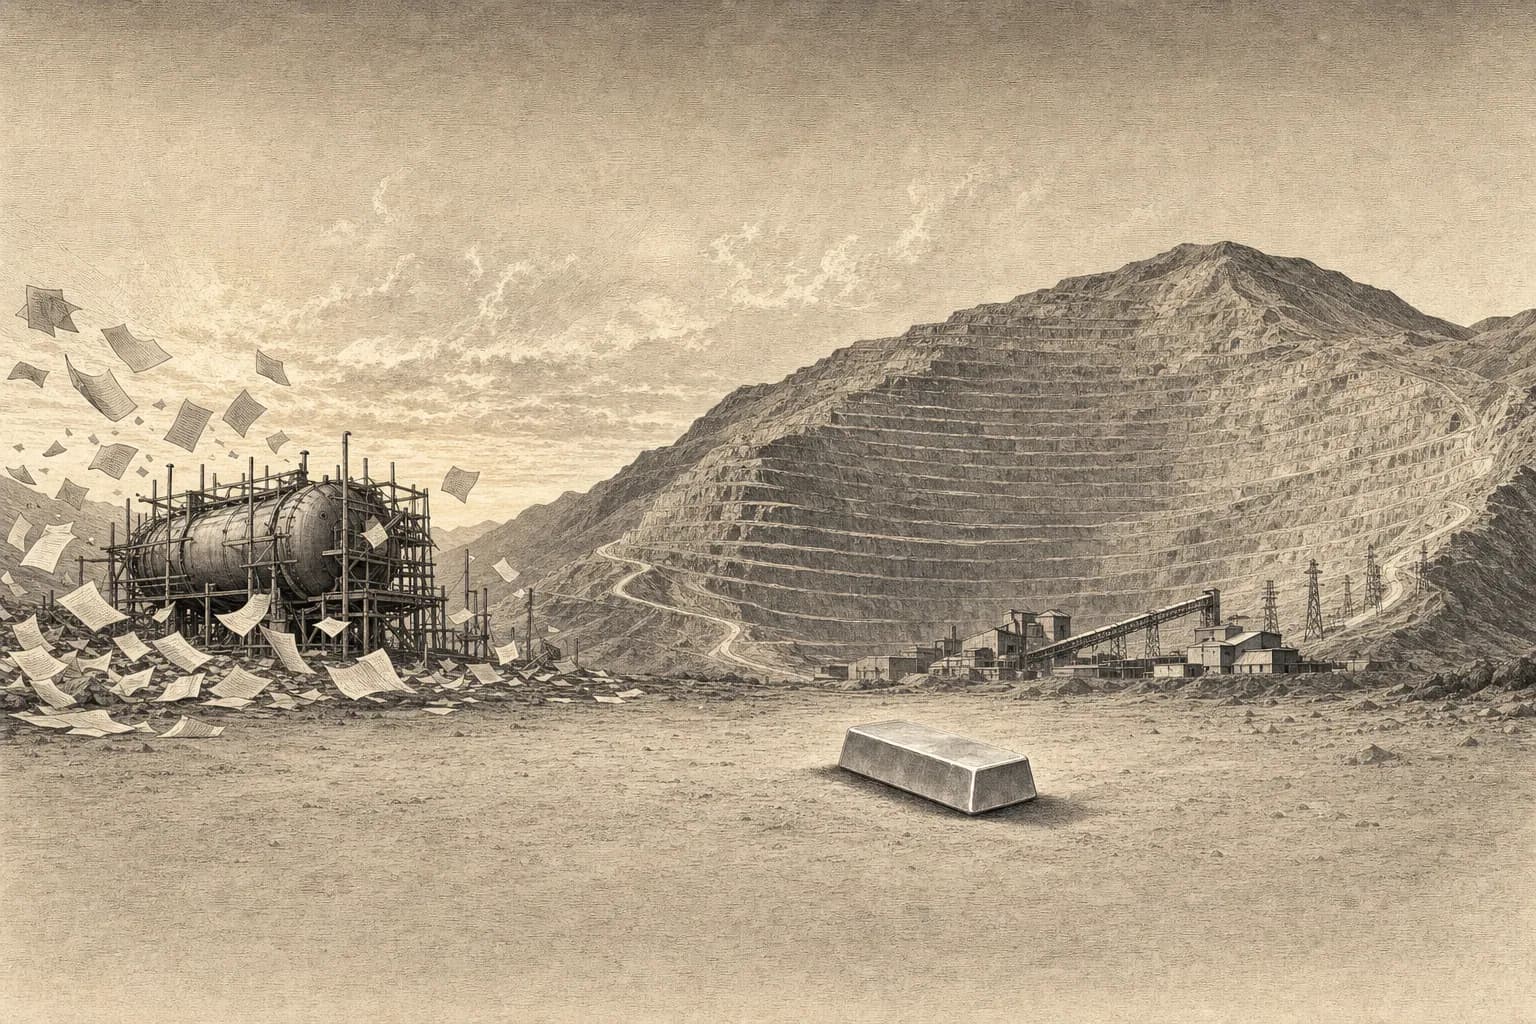
The autoclave is the reason. Hycroft's metal sits in sulphides that cyanide cannot reach. After grinding and flotation, the plan is pressure oxidation (POX) of the concentrate in sealed, heated, oxygen-pressurised vessels, followed by leaching. The study allocates $383.6M of direct capital to POX. The oxygen plant alone requires approximately 32 MW of installed power. POX, neutralisation and concentrate leaching consume reagents costing $6.74 per US short ton of mill feed, or $7.43 per metric tonne. That is what the autoclave on the cover represents: additional equipment, operating inputs and technical requirements, proposed for ore grading about 15 g/t silver. The $383.6M is already part of the total budget and is not added again. POX is industrially established; the challenges are the project-specific design, integration and commissioning of a circuit this large.
Corani's silver sits with lead and zinc in galena and sphalerite. Grind, float, ship two concentrates to a smelter. It is the oldest flowsheet in base-metal mining, it runs on standard equipment, and the lead and zinc pay a large part of the bill. Smelter and freight charges are included in the model. Hycroft's complete mill processing costs $16.65/short ton = $18.35/t in its study; Corani's historical $10.04/t becomes $13.05/t after my 30 percent allowance. Hycroft's processing route remains approximately 41 percent more expensive per metric tonne, even against the inflated Corani assumption. Differences in grade and recovery enter through payable production. That is the technical and economic advantage I see at Corani, and it does not depend on the silver price.
The capital comparison includes all metals and complete project cash flows. Corani requires $900M in the model and Hycroft $2,434M. At reference prices, both generate roughly $600M a year of free cash flow in their first three operating years after modelled taxes and ongoing investment, before the tail of initial construction spending. Read that twice: the same early cash flow, for 37 percent of the initial capital. This is where early, higher-grade production matters.
| Capital and return | Corani | Hycroft |
|---|---|---|
| Initial capital | 900 M USD | 2,434 M USD |
| Sustaining / closure, full study life | 29.2 M USD / 62.2 M USD | 3,107.0 M USD / 243.0 M USD |
| POX direct, included in total | — | 383.6 M USD |
| Process plant direct, respective study | 234 M USD (2019) | 979.7 M USD (2026) |
| NPV₅ / Initial-Capex | 2.85x | 3.01x |
| IRR after modelled taxes | 42.0 % | 23.7 % |
| Payback from operating start | 1.47 years | 3.68 years |
| FCF first three operating years, annual average | 602.5 M USD | 597.2 M USD |
| FCF lifetime annual average / initial capital | 37.4 % | 21.7 % |
Hycroft has the larger long-term asset; Corani returns capital sooner. Its modelled 1.47-year operating payback compares with 3.68 years, its 42.0 percent IRR with Hycroft's 23.7. Hycroft's 51-year life contributes to its higher absolute NPV but also requires $3.107bn of sustaining capital: mining accounts for $1.171bn and the sulphide process for $776M, so this is not all autoclave replacement. Corani's contractor model carries mining fleet costs in operating expenses. My thesis concerns the entire financing chain: a smaller initial cheque, earlier returns, and then the freedom to fund the next investment from the first one.
The market is pricing the permitted mine as if it were unpermitted and the assessed one as if it stood on the edge of a feasibility study. Both are wrong, and both correct in the same direction.
The updated feasibility study is the first major catalyst in the cascade. Highlander targets Q4 2026 in its August presentation and half-year report. The study will examine staged development and seek to improve capital requirements, funding and execution per share. AMC handles resources, reserves and mine planning; Ausenco handles the plant and infrastructure. A permitted project on a 2019 feasibility foundation is being reassessed in a metal-price environment the 2019 authors never contemplated. I expect more than a new date on the cover: a clearer route from Corani's metal in the ground to financeable cash flow.
Corani has a feasibility study and the principal permits for the development plan it describes, supported by community agreements. Work is underway on camp facilities, roads, earthworks and power infrastructure; Highlander has put a workforce of about 300 on site and ordered long-lead equipment. The updated study must establish the staged plan to be built and how it can be financed. This is Highlander's timing advantage: a substantial portion of the development work that precedes a construction decision is already done. Changes in scope or processing must still fit the permits.
Update, 23 September 2026. Highlander has executed a mandate letter with Natixis CIB to lead a fully underwritten, seven-year senior secured project finance facility of $330 million to fund the development and construction of Corani. A cost overrun facility of up to $100 million is to be established by the company itself before first draw; final amounts are subject to due diligence, and closing is expected in the first quarter of 2027. Three things about this matter. First, a project finance bank underwrites only after its own technical, environmental, social and financial due diligence. This is the first external verdict on Corani's economics on a price deck that does not date from 2019. Second, the bank is arriving at a site that is already under construction, not the other way round. Third, a mandate letter is not a loan agreement. The facility becomes rung 4 of the ladder in Section X when it is signed, not before. Hycroft, for comparison, has neither a mandate nor a bank for its autoclave plan.
Hycroft's study published in June 2026 is more recent, but it is an Initial Assessment, not a feasibility study. In its own words, it "does not demonstrate economic viability nor does it support a development decision". Further studies, detailed engineering, permits and funding for the new flotation/autoclave operation all remain ahead of a sound construction decision. The planned mill handles 57,100 US short tons daily, approximately 51,800 metric tonnes; the autoclaves treat the resulting concentrate. A newer date on the cover does not remove this difference in development stage.
The jurisdiction argument runs the other way from how it is usually told. Nevada earns a premium because permitting is predictable, but Hycroft has not yet obtained the permit that counts. Peru carries a discount because permitting and social licence are hard, and Corani already has both. The market is charging Highlander for a risk that has been retired and paying Hycroft for a certainty it has not yet used.
I therefore consider Corani more likely to start production before Hycroft's new sulphide operation. This is my judgement from permitting, ongoing site works, the smaller funding requirement and now a financing mandate; neither project has a confirmed start date. Construction duration alone does not establish the advantage: Corani's 2019 study allowed roughly 36 months from a decision, while Hycroft's new model assumes 24 months of construction. The decisive question is which project reaches a funded construction decision sooner. The updated Corani study and the Natixis closing must make that timing advantage tangible. Earlier cash flow could then fund feeder and porphyry exploration internally.
Equity analysis prices development projects on a ladder of price-to-NAV multiples that maps exactly this risk. These are my scenario assumptions, not guaranteed industry prices. The transitions describe a higher valuation of the same project; their share-price effects are not added repeatedly:
| Development stage | My assumed valuation range | Interpretation |
|---|---|---|
| PEA / Initial Assessment | 0.2–0.4x project NPV | Greater discount for technical, permitting and financing risk |
| PFS / FS, permits outstanding | 0.4–0.6x | Further development steps required |
| Permitted feasibility | 0.6–0.8x | My valuation framework for a more advanced project |
| Financed and under construction | 0.8–1.0x | Requires corresponding confirmation of financing and construction plans |
| Producer | No automatic multiple | Actual cash flow, remaining life and risk determine value |
At reference prices, Highlander's rounded EV is approximately 0.39x the 15-year Corani NPV; Hycroft's is approximately 0.24x its 51-year NPV. These ratios compare current EVs with project values at each construction start; they are not market-to-NAV multiples fully discounted to one calendar date. Hycroft has the lower raw ratio, and on that raw ratio it is priced at the top of its class. My mispricing thesis is more specific: Corani's earlier returns, smaller funding requirement, more advanced stage and now a mandated financing deserve a higher realisable share of NPV, and the stock trades below the class it belongs to. Moving from 0.39x towards my 0.6x–0.8x stages alone has a substantial effect on Highlander, without a new discovery and without a higher silver price.
Corani's only published NPV is seven years old and assumes a silver price of less than a third of today's. That number sits on every screen. The model below replaces it with a calculation that builds every year from payable production and gross costs. Silver, gold, lead and zinc generate separate revenues; operating costs, smelter charges, royalties, taxes, initial and sustaining investment, closure and working capital are then deducted. At reference prices, Corani produces $2.57bn NPV₅ and Hycroft $7.34bn. Highlander's strength lies in returns on capital, earlier cash generation and greater relative silver exposure, not in absolute size.
Annual quantities come from Table 22-15 of Corani's 2019 feasibility study and Table 19-2 of Hycroft's 2026 Initial Assessment. Corani's high early silver production is retained rather than flattened to 9.6 Moz per year. I increase its gross costs by 30 percent and scale initial capital to $900M. Zinc-linked smelter adjustments and the subsequent 3.25 percent private NSR royalties enter their respective lines. Hycroft's costs are in Q1 2026 dollars. Both models use constant real prices and 5 or 8 percent discounting from their respective construction starts.
After-tax values are the author's calculations. They include Peru's progressive mining charges, worker participation and corporate income tax, or Nevada charges and US federal tax. Both use ten-year depreciation for initial capital and five years for sustaining investment; existing tax losses and US special relief are not credited. This disclosed approximation avoids carrying Hycroft's original tax payments unchanged into higher price cases. The downloadable model contains all annual rows, assumptions and sources. Corani's new study remains the next test of the construction and operating cost assumptions.
Both projects on the same price deck
| Scenario | Ag $/oz | Corani NPV₅ | Hycroft NPV₅ | IRR C / H | Payback C / H yr |
|---|---|---|---|---|---|
| All metals −20% | 52.90 $ | 1.67 bn USD | 3.89 bn USD | 32.0 % / 15.6 % | 1.98 / 5.15 |
| Reference deck | 66.13 $ | 2.57 bn USD | 7.34 bn USD | 42.0 % / 23.7 % | 1.47 / 3.68 |
| All metals +20% | 79.36 $ | 3.46 bn USD | 10.78 bn USD | 50.8 % / 31.0 % | 1.17 / 3.01 |
| GSR 30 · Au unchanged | 145.90 $ | 6.78 bn USD | 13.85 bn USD | 78.2 % / 35.0 % | 0.65 / 2.82 |
| GSR 15 · Au unchanged | 291.80 $ | 14.44 bn USD | 25.77 bn USD | 122.2 % / 51.9 % | 0.32 / 2.18 |
| Gross costs +20% | 66.13 $ | 2.28 bn USD | 5.72 bn USD | 39.5 % / 20.0 % | 1.58 / 4.16 |
The ±20 percent price tests move all four metals together. In the GSR bull cases only silver rises; gold, lead and zinc stay at reference prices. The cost stress adds another 20 percent to the already inflated gross operating costs, smelter charges, sustaining and closure costs, with metal prices unchanged. At an 8 percent discount rate instead of 5, the reference values are $1.95bn for Corani and $4.13bn for Hycroft; Hycroft's longer life is more sensitive to the higher rate.
The Bull Case: Value Supported by Each Initial Dollar
| Comparison | Corani | Hycroft |
|---|---|---|
| Reference deck · NPV₅ / Initial-Capex | 2.85x | 3.01x |
| Reference deck · NPV₅ relative to reference prices | 1.00x | 1.00x |
| Reference deck · operating margin | 63.7 % | 57.3 % |
| GSR 30 · Au unchanged · NPV₅ / Initial-Capex | 7.53x | 5.69x |
| GSR 30 · Au unchanged · NPV₅ relative to reference prices | 2.64x | 1.89x |
| GSR 30 · Au unchanged · operating margin | 79.4 % | 69.0 % |
| GSR 15 · Au unchanged · NPV₅ / Initial-Capex | 16.05x | 10.59x |
| GSR 15 · Au unchanged · NPV₅ relative to reference prices | 5.62x | 3.51x |
| GSR 15 · Au unchanged · operating margin | 87.5 % | 78.9 % |
This makes the silver argument quantitative. At GSR 30, Corani offers $7.53 of project NPV per $1 of initial capital against $5.69; at GSR 15, $16.05 versus $10.59. Corani's project value grows faster, capital is repaid sooner and its operating margin widens more. Hycroft retains the higher absolute NPV. Whoever is betting on silver against gold is, in this pair, betting on Highlander against Hycroft. The equity thesis then adds the next question in the cascade: how much of that value will the market pay for as study, financing and construction make delivery more tangible?
A resource is not rock. It is a price assumption drawn around rock. Higher silver prices can therefore affect quantities twice: they can make existing resources economic as reserves, and they can enlarge the reported resource itself when previously excluded material, including material outside the economic pit envelope, meets the criteria. Infill and new discoveries add further routes. The roughly 100 million tonnes between Corani's reserve and its M&I resource are the first expansion step, not the limit of the opportunity.
Corani has three distinct price bases in its 2019 work. The resource pit used $30/oz silver, $1.425/lb lead and $1.50/lb zinc; the reserve pit used $20/oz silver, $0.95/lb lead and $1.00/lb zinc. The financial valuation used $18/oz silver, $0.95/lb lead and $1.10/lb zinc. Today silver and zinc are above the old resource assumptions, while lead is below them. The greater silver leverage is real, but an updated pit envelope must account for all metals, costs and geotechnical limits. Higher prices do not automatically turn resources into reserves; processing, mine planning and economics must be confirmed.
| Category, Corani 2019 | Tonnage | Silver grade | Contained silver | Timeframe interpretation |
|---|---|---|---|---|
| P&P reserve, $20 Ag pit assumption | 138.6 Mt | 51.3 g/t | ~229 Moz | Published 15-year mine plan |
| Measured & Indicated, including reserve, $30 Ag resource assumption | 238.6 Mt | 42.1 g/t | 322.7 Moz | ~24 years from simple tonnage/27,000-tonnes-per-day arithmetic; not a confirmed mine plan |
| M&I + Inferred, flotation resource, reserve not added again | 311.8 Mt | 40.5 g/t | 406.2 Moz | ~32 years from simple throughput arithmetic; Inferred cannot be treated as reserve |
| Additional potentially leachable M&I, 15 g/t cutoff | 40.4 Mt | 30.0 g/t | 39.0 Moz | Separately in Table 14-18; outside my cash-flow model |
| Additional potentially leachable Inferred, 15 g/t cutoff | 24.3 Mt | 38.2 g/t | 29.9 Moz | Separate resource pool; economic processing requires assessment |
M&I already includes the reserve. The flotation resource comprises 322.7 Moz M&I plus 83.5 Moz Inferred, totalling 406.2 Moz. These are contained silver ounces; gold, lead and zinc equivalents are not added here. Subtracting the 138.582 Mt reserve leaves roughly 100.053 Mt within M&I containing 94.1 Moz silver, or approximately 29.2 g/t. The $20 pit left that rock behind not because it is missing, but because at $20 it would not have paid. At $66 it does. The conversion case reflects these lower grades; annual production is not simply extended unchanged.
The original study already contains more than the flotation case. Table 14-18 separately reports 39.0 Moz M&I and 29.9 Moz Inferred in potentially leachable material. Its accompanying text places these quantities outside Table 14-17 and outside the reserve. Together, the two resource pools contain approximately 475.1 Moz silver, with confidence categories and processing routes kept distinct. A 15 g/t cutoff is already documented for this separate pool; it is neither its average grade nor a new Highlander commitment. Those 68.9 Moz are a concrete additional opportunity whose economic use still needs to be demonstrated. My 15- and 24-year cash-flow models book no revenue for them.
Reserve conversion. My 24-year case processes 235.329 Mt in total, within today's M&I tonnage and with no more than approximately 9.855 Mt of annual capacity for the extension. Spare capacity in the existing final operating year is filled, followed by nine additional years. Total payable silver becomes 201.5 Moz, rather than the 230.4 Moz a flat extension would imply. I allow $150M of expansion capital and $3M of additional annual sustaining investment. NPV₅ rises from $2.57bn to $2.88bn at reference prices, from $6.78bn to $7.97bn at GSR 30 and from $14.44bn to $17.21bn at GSR 15. This is a quantified conversion scenario whose mine plan and recovery still require confirmation in updated technical work.
Resource expansion. At an average grade of 15 g/t, a tonne contains approximately 0.482 oz silver: $14.47/t of gross metal value at $30 silver, versus $31.89/t at $66.13. That is why lower-grade material becomes economically relevant. Recovery, smelter deductions, lead and zinc, stripping and costs determine its actual value; Corani's flotation resource uses an NSR cutoff, net smelter revenue per tonne. A higher silver price can therefore change the size of the resource, not only its subsequent conversion into reserves.
What would a doubling require? Doubling the present flotation base from 406.2 to 812.4 Moz silver would require another 406.2 Moz to be established. At an assumed average grade of 15 g/t, that means approximately 842 Mt of additional material. A 15 g/t cutoff would not mean that all newly included material averages exactly 15 g/t; the actual grade-tonnage distribution of the block model is needed. This calculation sizes the requirement rather than establishing the tonnage. Highlander has not published a doubling target, and already reported leachable material must not be counted twice in a future combined total.
Work on a larger base is already underway. Highlander's published programme explicitly targets resource growth, infill and oxide material; geophysics identifies targets beyond the historically drilled area. Its August presentation reported six active rigs. That establishes work on growth, not a new 15 g/t flotation cutoff or a doubling. A flotation resource doubled to 812.4 Moz would already exceed Hycroft's 695.4 Moz M&I plus Inferred in a silver-only comparison; Hycroft's additional gold remains included in the all-metal comparison. My thesis is that the market underprices Highlander's potential resource expansion. Drilling and the new resource model must establish its actual scale.
Infill. The current programme explicitly includes infill drilling. It is intended to improve geological confidence and may move part of the roughly 73 Mt of Inferred material containing about 84 Moz silver into M&I. Economic assessment for reserve conversion follows. Successful work would add those ounces to the conversion opportunity described above; they are not booked into its revenues in advance.
The cascade therefore runs further than lengthening the old reserve plan: higher prices → a larger economic resource envelope → more material assessable as reserves → a larger mine plan. Infill improves confidence; new drilling establishes additional mineralised rock. A feeder or porphyry discovery would be a further, separate stage. Updated feasibility and ongoing exploration interact here, and my quantified 24-year case does not exhaust the opportunity.
The updated study can reveal the existing project's value; a larger resource base can expand it; financing and construction progress can reduce the valuation discount. A silver bull market affects both margins and economic quantity limits. Feeder or porphyry evidence would add another discovery stage. The following table values only the existing reserve and the bounded M&I conversion case. Neither a doubling of resources nor a deep discovery is in these equity values.
The table translates project values at construction start into an equity framework: Corani NPV times my selected multiple, plus my $150M net value assumption for San Luis and Mercedes and $100M rounded cash, divided by 203.5M basic shares reported as of 12 August 2026. The 24 years refer to the conversion case in Section VII; 1.5x is my optimistic producer assumption. Values are in today's real dollars but have not been reduced for a wait until construction starts. Two additional years at a 5 percent discount rate would reduce the project component alone by 9.3 percent, before preconstruction spending. A future share price also requires rolling forward the remaining mine value, cash and financing. The final column compares these conditional scenarios with the $5.50 US closing price on 18 September.
| Cascade stage | Ag $/oz | Years | Corani NPV₅ | Multiple | Equity value | Per share USD | vs. $5.50 |
|---|---|---|---|---|---|---|---|
| Study: reserve base | 66.13 $ | 15 | 2.57 bn USD | 0.6x | 1.79 bn USD | 8.80 $ | +60 % |
| Conversion: 24-year case | 66.13 $ | 24 | 2.88 bn USD | 0.6x | 1.98 bn USD | 9.71 $ | +77 % |
| Funding discount narrows | 66.13 $ | 24 | 2.88 bn USD | 0.8x | 2.55 bn USD | 12.54 $ | +128 % |
| Producer bull case | 66.13 $ | 24 | 2.88 bn USD | 1.5x | 4.57 bn USD | 22.43 $ | +308 % |
| Silver bull case GSR 30 | 145.90 $ | 24 | 7.97 bn USD | 1.5x | 12.20 bn USD | 59.94 $ | +990 % |
| Silver bull case GSR 15 | 291.80 $ | 24 | 17.21 bn USD | 1.5x | 26.07 bn USD | 128.09 $ | +2,229 % |
| Feeder / porphyry | — | — | — | — | additional, unvalued | — | — |
The first row needs neither a higher silver price nor a drill hole nor a multiple the market does not already grant other permitted developers. It needs a document that is due this quarter and a bank that has now put its name to the project. The 24-year conversion adds a layer on top. At GSR 30 and 15, silver amplifies that larger base. None of it requires a feeder or a porphyry. A discovery would be the next, separate step, with the potential to turn a single mine into a district. Filo del Sol and Cadia illustrate the scale of successful district development; I do not transfer their purchase prices or resources to an undrilled Corani target.
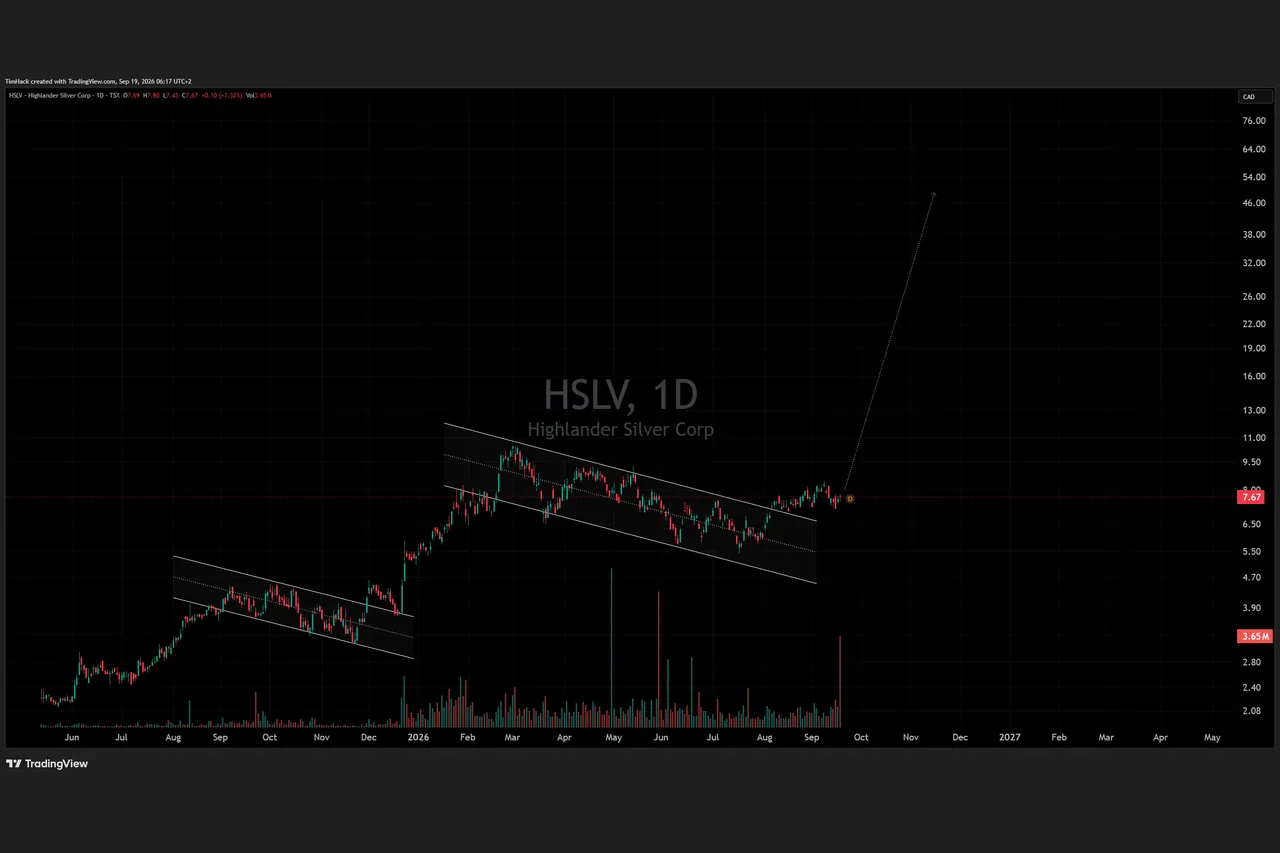
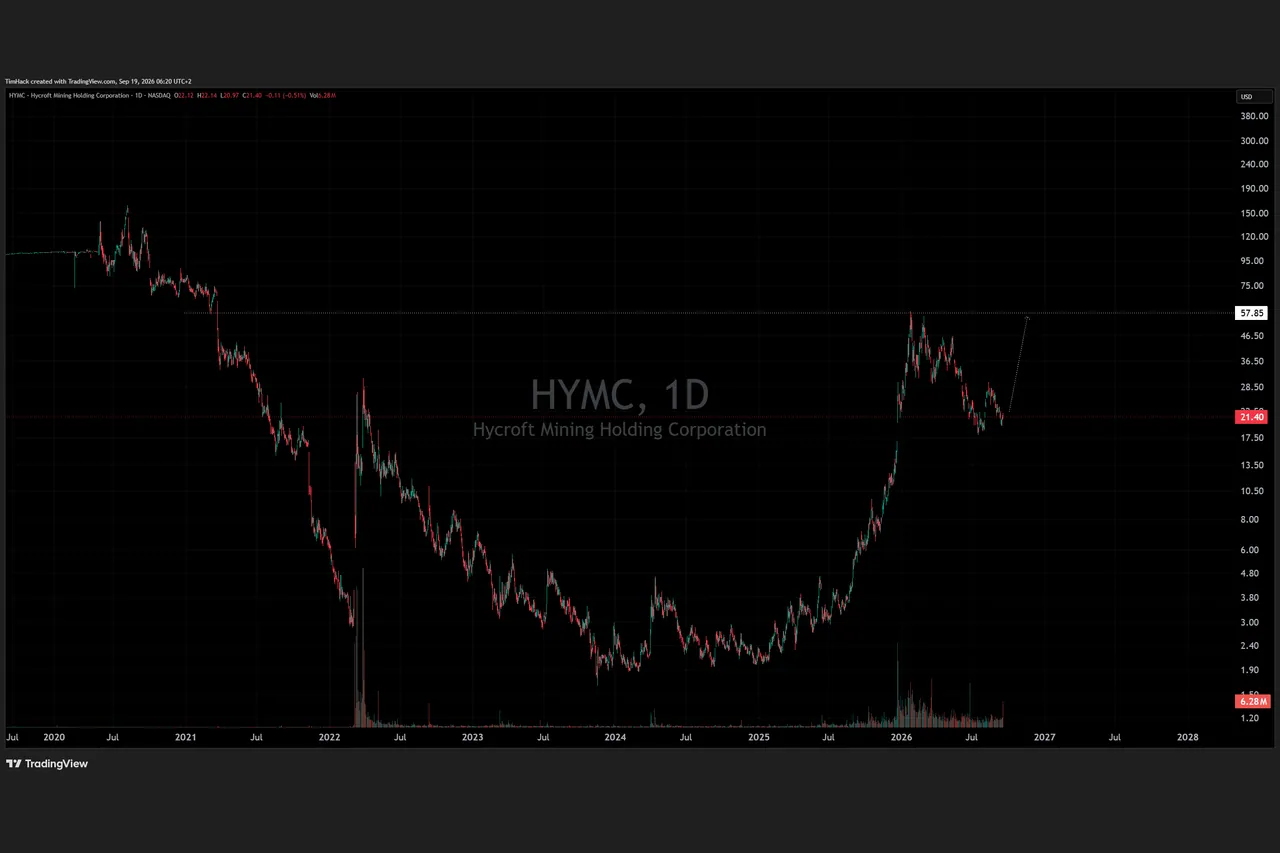
I still expect Highlander to overtake Hycroft in market capitalisation. At reference prices, even the 15-year reserve base at 0.8x NPV plus portfolio and cash implies approximately $2.31bn; the 24-year case implies approximately $2.55bn. Both exceed Hycroft's roughly $2.0bn market value used here. That needs neither higher silver nor a discovery, only a higher valuation of a better-demonstrated, financeable development. The chart arrows show my personal expectation by Christmas, approximately 7x for Highlander and 3x for Hycroft, and are not dated price targets derived from the DCF. The tape already shows Highlander's relative strength: on 18 September, HSLV at C$7.67 is only 27.0 percent below its C$10.50 52-week high, whereas HYMC at US$21.40 is 63.6 percent below US$58.73. Highlander's pullback is 36.6 percentage points smaller. Both daily charts use logarithmic scales. Each decline is (closing price ÷ 52-week high − 1) × 100 in the stock's trading currency, the current distance below the high rather than the maximum intervening drawdown. Together with the breakout above the descending channel, the smaller pullback shows how much better Highlander has held its price.
Financing as an explicit calculation, updated 23 September 2026. The original example assumed a $900M package of $100M existing cash, $540M debt and $260M new equity: approximately 47.3M new shares at a $5.50 issue price, a 23.2 percent increase, with the new shares also bringing in $260M of equity capital. The Natixis mandate replaces the debt assumption with a mandated figure: $330M. Two adjustments follow. The $100M of cash is not free, because the cost overrun facility of up to $100M has to be provided by the company before first draw. On the full $900M programme that leaves roughly $470M to be covered by equity, a stream or cash flow. That is probably the wrong base, however: project lenders typically finance 55 to 65 percent of initial capital, and $330M of senior debt sizes a staged first phase of roughly $500M to $600M, not $900M. This is my inference from the facility size, not a company figure, and the updated study must confirm it. Within that range the equity gap is $170M to $270M: 31M to 49M new shares at $5.50, a 15 to 24 percent increase, or 21M to 34M shares at $8.00 after a re-rating, 10 to 17 percent. Mercedes cash flow and a stream on San Luis or Corani could lower the figure further. Holding the 24-year project value at 0.8x gives approximately $11.21 per share on 250.8M shares in the original example, and approximately $12.00 per share on about 235M shares in the $550M case, each before financing costs. Actual interest, fees, streams, covenants and issue prices determine the outcome; the mandate is not yet a signed facility.
Corani carries the calculation. Everything in this section stands in the company and nowhere in the model. San Luis and Mercedes broaden the portfolio; Section VIII includes $150M for both, separate from cash. The 24-year case includes the explicitly modelled M&I conversion. Deep exploration is a further opportunity, and none of its potential discoveries is in those values.
San Luis. The project's Indicated resource contains 356 koz of gold at 24.4 g/t and 8.4 Moz of silver at 579 g/t. Those grades put it among the ten highest-grade projects in the world in both metals. I consider it an important portfolio asset; its standalone project value is not calculated here.
Mercedes. The mine produced 8,147 oz gold and 34,583 oz silver in the second quarter of 2026, and Highlander reports approximately 30 koz gold for 2025. The half-year report describes ongoing improvements to mine development, safety, infrastructure and costs; it establishes production, not yet sustained free cash flow. The asset includes a 2,000-tonne-per-day plant and 69,284 hectares of concessions. A suitable operator or partner could unlock additional value. My combined $150M net value assumption for Mercedes and San Luis is not a separate valuation of each; obligations, royalties and further investment must be accommodated within it. At Hycroft, active mining ended in November 2021 and residual leach-pad processing in December 2022.
Corani is more advanced as a mine project and less fully discovered as a deep exploration story. That is the asymmetry. Hycroft's high-grade structures are visible; Corani's possible comparable discovery still lies ahead. What follows stands in no model and no scenario row of this text. It is speculation, and I call it that. But it is speculation with a technical report, a geophysical survey and an active drill programme behind it, and with one property that separates it from any greenfield story: the pit above it pays for it. My cascade is: the mine funds the search, a discovery uses the infrastructure, and the larger mine funds the next step. Drilling is already financed from cash alongside the updated feasibility work. Later, an earlier production start could fund the next exploration round from cash flow. The first discovery does not have to wait for the mine to start.
First clue: where did the metals come from? The 2019 report describes a "distal setting surrounding a buried intrusion" and a possible porphyry system that "possibly underlies the southern part of the area". Both statements concern the position of the known mineralisation relative to its source: Corani could be laterally and vertically removed from a deeper magmatic system. Southern quartz-pyrite-chalcopyrite and finer northern pyrite support the interpretation of northward hydrothermal flow. Chalcopyrite is copper sulphide. The report also considers shallow subvolcanic domes. The porphyry idea is therefore already in the technical documentation; its specific source remains to be drilled.
Second clue: the south and concealed ground. Historical hole DDH-C52 returned 14 m at 11.7 g/t gold and 48.9 g/t silver from 32 m at Corani South, in a deposit classified as silver-lead-zinc; true width is unknown. The 2026 geophysics, the first airborne magnetics ever flown over the property, associates this area with structural intersections and identifies another target beneath shallow cover at Corani West. Highlander interprets the mineral system as substantially more extensive than the drilled resource footprint. Alteration, metal distribution, drill intersections and geophysics together give the feeder and porphyry search a concrete direction.
Third point: the open discovery stage. The historical database includes 562 holes totalling 101,401 metres, an average hole length of roughly 180 metres. Corani was drilled as an open pit, to pit depth, and hardly a metre further. Deeper and concealed targets remain open. The report also describes known mineralisation ending above the basement in investigated areas; simply drilling deeper there does not guarantee ore. The thesis therefore concerns targeted structural and source exploration, especially to the south and west. A confirmed high-grade feeder would be new evidence; an economic porphyry would be a further, distinct step. Both potential revaluations remain entirely outside today's Corani cash-flow model.
What is already being drilled. Highlander described a 25,000-metre programme to me in late August covering infill, metallurgy, geotechnical work and exploration. According to that information, exploration holes average 300 metres, with some planned beyond 600 metres. They include tests of possible feeder structures at Corani South, particularly intersections of north-south and northwest structures. A follow-up programme is being prepared for the deeper covered targets at Corani West. These are programme details supplied to the author and planned hole lengths, not published discoveries. The central point stands: work on the second stage of the cascade has already begun; it does not have to wait for mine construction.
The pattern. Epithermal silver-gold systems sitting above porphyries are not a curiosity but a textbook model, and some of the world's best-known porphyries were found because someone drilled beneath a known epithermal deposit. Lepanto/Far Southeast and Yanacocha/Kupfertal illustrate the geological connection; Cadia illustrates the economic one, where an additional major deposit turned a known project into a much larger district. These examples support the exploration idea and the development path; Corani has to deliver its own discovery.
| Known deposit / district | Deeper or nearby discovery | Country |
|---|---|---|
| Lepanto | Far Southeast | Philippines |
| Yanacocha | Kupfertal | Peru |
| Cadia Hill (open pit) | Cadia East (underground) | Australia |
Cadia East was discovered in 1994; Cadia Hill entered production only in 1998, so the initial discovery was not financed by an operating mine. The relevant idea for Corani is what came after: once infrastructure exists, a suitable new deposit inherits it. That is the advantage the cascade is designed to capture.
The cascade. At reference prices, the reserve case generates approximately $337M annually over its operating life after modelled taxes and ongoing investment, and approximately $602M annually in the first three operating years, before remaining initial capital. An assumed $10–15M budget for 20,000 metres of deep drilling represents approximately 11–16 days of average cash flow. That budget assumes $500–750 per metre; it is not a contractor quotation. The scale shows why a successful mine start fundamentally changes the funding of further exploration:
| Stage | Development | Funded by | What it enables |
|---|---|---|---|
| 1 | Corani open pit | Cash, project debt (Natixis mandate), limited equity; staged development to be assessed | Operating cash flow and infrastructure |
| 2 | Feeder exploration at Corani South; West follow-up | Cash today; cash flow from stage 1 later | Test high-grade targets beneath/beside the bulk mineralisation |
| 3 | Potential underground extension after discovery | Mine cash flow; additional capital according to design | Use existing mill, roads and power where technically suitable |
| 4 | Potential southern porphyry | Returns from earlier stages or a strategic partner | Copper-gold district with a different buyer base and capital scale |
The cascade connects finance and geology. A high-grade intersection at 700 metres beneath an operating mill is ore on the day it is assayed; the same intersection on greenfield ground is a decade and a billion dollars away from a mine. Where location and metallurgy fit, shared facilities reduce investment and accelerate development. A possible feeder therefore means more to me than additional ounces: it would raise the value of infrastructure already financed and make the next development step easier. That is a reinforcing economic relationship, and each expansion stage still requires a workable mine plan and suitable permits. Debt rather than equity for stage 1 is what keeps stages 2 to 4 in the hands of today's shareholders; that is why the Natixis mandate matters to this section, not only to Section V.
Hycroft illustrates the discovery stage still ahead of Corani. Vortex and Brimstone have confirmed high-grade drill intersections. Hycroft's 9 September 2026 release interprets the Central and Albert faults as productive feeder structures at Vortex. The market can already value these results, and I assume part of that discovery effect is in Hycroft's price. The geophysical anomaly beneath Brimstone remains a target; an economic porphyry has not been demonstrated. Corani has yet to deliver comparable feeder evidence. At Highlander, I am therefore buying a more advanced mine foundation with a geological revaluation stage still open. Market awareness differs from inclusion in a mine plan: according to Hycroft, results from its 2025/26 drill programme are not yet in the study's economic analysis. Further discoveries and an updated plan can therefore change Hycroft too.
Highlander starts from the smaller base. The reference gross-metal calculation gives approximately 462.7 Moz AgEq against 1,649.0 Moz. The same additional metal quantity expands Highlander's starting base approximately 3.6 times as much in relative terms. That is not an automatic share-price multiplier, but it explains why a successful discovery would disproportionately change perceptions of the smaller company. The pit already supports the valuation; the deep exploration story can recast it.
Passive buyers can reinforce the cascade. Highlander is already present in important funds, at different weights from Hycroft. A larger market capitalisation and changes in free float can enable higher weights or additional inclusion at future index reviews. Rules-based demand would then meet a market in which a major sponsor already holds a substantial stake:
| ETF, issuer information as of 17 September 2026 | Hycroft | Highlander |
|---|---|---|
| GDXJ | 0.33% · $29.7M | 0.06% · $5.3M |
| SIL | 0.56% · 1.299M shares | 0.43% · 3.972M shares |
| SILJ | Already included, according to Hycroft | Possible November 2026 inclusion according to Highlander's August presentation |
SIL and MSCI Small Cap inclusion have already been achieved. The August presentation identifies possible SILJ inclusion in November 2026 as a next step. The opportunity is additional inclusion and higher weights, not the incorrect claim that silver funds have yet to discover Highlander. I assume no fixed purchase amount. The chain still holds: project progress can trigger revaluation, a larger market value can change index demand, and additional demand can reinforce the revaluation.
The sponsor. Richard Warke and the Augusta Group combine development experience with substantial capital at stake. The 10 March 2026 filing reports Warke's 23.2 percent beneficial ownership on a partly diluted basis. In a capital-intensive development, that combination of experience, influence and ownership is part of my thesis, and a fully underwritten bank mandate is the kind of outcome it is meant to produce. At Hycroft, David Brian Thomas sold 25,000 shares on 16 June at an average $26.32 and retained a holding. I do not turn a single sale into a verdict on the mine; my focus is who can organise and finance Highlander's next development step.
The ladder begins with a specific next event: updated feasibility in Q4 2026 → a financeable construction plan → a potentially earlier production start → cash flow → further development. In parallel run resource growth → infill and conversion → potential feeder and porphyry discovery. Rung 4 arrived on 23 September 2026 as a mandate, ahead of rung 1; the order of the ladder was an expectation, not a condition. Hycroft's current-year preliminary assessment and confirmed high-grade structures are already known. More of those demonstrations still lie ahead for Highlander. That is the combination I believe the market underestimates: further along towards construction, earlier in the discovery effect. The stages reinforce each other; their percentage effects are not simply added.
| Stage | Event | Mechanism | Timing | Scenario effect |
|---|---|---|---|---|
| 1 | Updated feasibility | Current prices, annual plan and costs become visible | Q4 2026 per project slide | Disclosure gap narrows |
| 2 | Cost and capital confirmation | Flotation and smaller initial cheque become financeable | With study and engineering | 0.39x towards 0.6x in my framework |
| 3 | M&I conversion | More economic years from known resources | Following an updated mine plan | 24-year case: $2.88bn at reference prices |
| 4 | Financing | $330M project finance mandate in hand (Natixis CIB); definitive documentation and closing outstanding | Mandate 23 Sept. 2026; closing expected Q1 2027 | Mandate: 0.39x towards 0.55x; signed facility: towards 0.8x in my framework |
| 5 | Index weights | Rebalancing can generate additional share demand | Possible SILJ inclusion November 2026 | Demand can reinforce revaluation |
| 6 | Larger resource envelope, infill and oxide targets | Higher prices and drilling can make additional quantities economically reportable | Updated resource model and current programme | Additional to the M&I case; doubling shown only as a scale calculation |
| 7 | Deep drilling | Test feeder/porphyry hypothesis | 2026 programme and follow-up | Potential revaluation of the entire district |
| 8 | Construction and first concentrate | Cash flow funds further exploration and expansion | After financing and construction | Producer bull case at an assumed 1.5x |
| 9 | San Luis and Mercedes | Development, partnership or value realisation | Project-dependent | Portfolio broadens sources of capital |
A countercheck is not a list of reasons to do nothing. It measures how much each assumption matters, and whether the chain survives when it is wrong:
| Objection | Response |
|---|---|
| Higher capital | At $1.1bn instead of $0.9bn, Corani's reference NPV₅ falls to $2.45bn. The thesis does not depend on the historical $579M budget. |
| Higher operating costs | Another 20% on gross costs and ongoing investment leaves $2.28bn of Corani NPV₅. Other metals remain individually priced. |
| Dilution | The Natixis mandate replaces most of the equity requirement with debt. The remaining gap depends on the staged study's capex; Section VIII calculates 15 to 24 percent new shares at $5.50 and materially less at a higher price. Both cases stay well above today's price in the base scenario. Shareholder names do not replace funding terms. |
| "A mandate letter is not money" | Correct. Natixis underwrites after due diligence, and final amounts can change. The mandate is evidence that a project bank rates Corani as bankable; the facility itself becomes rung 4 only when signed. Hycroft has neither a mandate nor a bank for its autoclave plan. |
| Peru | Permits and community agreements are an achieved advantage. Ongoing implementation and any plan expansion remain the company's responsibility. |
| No deep discovery | The reserve case and separate M&I conversion case do not require a feeder or porphyry discovery. Failure would affect the additional exploration thesis, not the base. |
| Further Hycroft discoveries | Confirmed high-grade ounces can improve Hycroft's mine plan. My preference for Highlander is a relative thesis and does not require its competitor to fail. |
| Silver at $40 | With gold, lead and zinc unchanged, Corani NPV₅ is $1.16bn and Hycroft's $5.20bn. Gold gives Hycroft a real buffer; Highlander's greater silver exposure works in both directions. |
| Delay | Project values are measured from construction start. Additional delay reduces their present value; the new study and the Natixis closing must make the timetable more tangible. |
My conclusion is clear: I consider Highlander undervalued relative to Hycroft. Corani is further along the path to a mine, while an entire geological discovery stage still lies ahead. Conventional flotation, lower initial capital, faster capital recovery and permitting progress support the economic foundation, and a fully underwritten project finance mandate now supports the financing. They also underpin my expectation that Corani could produce before Hycroft's new sulphide operation. The feasibility study announced for Q4 2026 and the closing of the Natixis facility expected in Q1 2027 are the next two catalysts: the first document fixes the capital cost, the second pays for it.
Hycroft's high-grade zones are demonstrated by drilling, while their feeder function is a geological interpretation; Corani's possible comparable evidence still lies ahead. That open feeder/porphyry stage, a resource base potentially enlarged by higher prices and drilling, and subsequent reserve conversion provide further opportunities beyond today's cash-flow model. I consider them underpriced at Highlander. Hycroft's gold and higher absolute NPV are included; my preference rests on the interaction of development progress, silver exposure and an open discovery opportunity. GSR 30 or 15 amplifies that interaction. This chain — the study, more economic rock, financing, potentially earlier production and the next discovery stage — is my mispricing thesis.
Hycroft got the headline. Highlander got the mine. Now the mine has its bank. I own the mine.
The author holds a significant long position in Highlander Silver and no position in Hycroft Mining. This is not investment advice.
Model assumptions. Annual model using published payable production and cost schedules, 15 years for Corani and 51 for Hycroft, plus a separate author Corani conversion scenario through year 24. Prices dated 18 September 2026: Ag $66.13/oz, Au $4,377/oz, Pb $0.84731054716/lb, Zn $1.8189054037/lb. GSR 30/15 hold gold, lead and zinc constant. Corani: $900M initial capital, historical gross costs plus 30%, zinc-linked TC adjustment, 3.25% private NSR approximated on metal revenue after TC/RC and freight. Hycroft: Q1 2026 costs, $2,434M initial, $3,107M sustaining and $243M closure capital, private NSR of 1.5% grossed up for 30% withholding tax. No duplicated by-product credit or capital deduction. Closure, salvage and working capital are separate; historical tax receivables are not imported as present-day assets. Midyear discounting from each project's construction start. After-tax calculations approximate tax bases annually and use ten-/five-year straight-line depreciation; company-specific tax losses, bonus depreciation, depletion and FDII benefits are not credited. This is not a new technical study or an exact reproduction of company tax planning. The complete model documents rounding and inconsistencies in source tables without balancing plugs. The extension constrains tonnes, grade and payable metal to existing M&I and includes additional investment; Inferred material and discoveries remain outside. Equity values use rounded market values and dated cash balances; the 203.5M basic shares are from the 12 August disclosure and exclude additional options/warrants. The equity table uses construction-start project values without an additional waiting-period discount; corporate costs and a complete financing plan are not separately modelled. Financing, project multiples, portfolio value and chart arrows are explicitly the author's assumptions. The staged-capex range inferred from the Natixis facility size is the author's inference, not a company figure.
Sources.
This page does not constitute investment advice, an investment recommendation, an offer, or a solicitation to buy or sell any financial instrument. Trading financial instruments involves substantial risk, up to and including total loss of capital; individual results may differ materially. Vaapad Capital is not a licensed investment firm and does not provide portfolio management. Past performance is not a reliable indicator of future results. The operator may hold positions in instruments discussed, which can create conflicts of interest. An article establishes neither current holdings nor a contemporaneous trade rationale. Available broker holdings and their data timestamp are shown under Portfolio in the member terminal. .